Former upstream Pro component: <wa-line-chart>. Category: Portable Alternatives · Implementation: MyST/SVG.
Use this documentation recipe without importing Web Awesome Pro code. The former component is named for compatibility and discovery only; the alternative is not API-equivalent.
Portable example
Use a checked-in static SVG image and a MyST table. The figure requires no custom chart runtime; interactive filtering, tooltips and live recalculation are not provided.
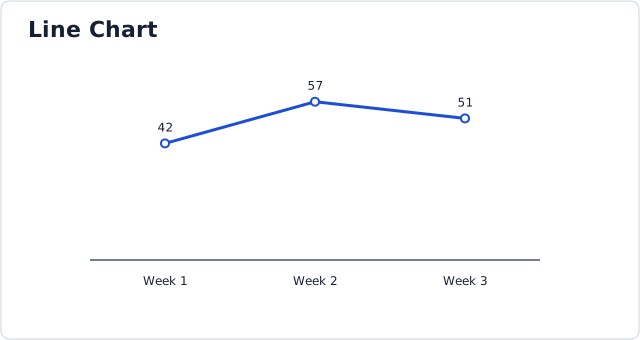
Figure 1:Static SVG example. The table below is the accessible source of the same illustrative data.
Table 1:Line Chart source data
| Period | Requests |
|---|---|
| Week 1 | 42 |
| Week 2 | 57 |
| Week 3 | 51 |
Accessibility and compatibility
The SVG has an accessible title and description, but the table contains the precise underlying values and remains usable in text and non-HTML exports. The example data are illustrative, not live operational measurements. No Web Awesome Pro elements, Pro imports or client-side chart libraries are used.
References: MyST specification, MyST figures, MyST tables, Web Awesome upstream reference.